
Market Recap - Week of January 26 - 30, 2026
- Gordon Achtermann

- Feb 2
- 3 min read
Updated: Mar 15
After falling 0.4% last week, the S&P 500 index edged up 0.3% this week, lifting the market benchmark's January gain to 1.4%. So far this year, small US companies and emerging markets indexes have far outgained the big US index.
The S&P 500 ended Friday's session at 6,939.03, near but slightly below the record closing high it reached earlier this week at 6,978.60. The index also posted a record intraday high this week at 7,002.28.
The slim move came as investors parsed through quarterly earnings reports. Better-than-expected results were posted by companies including Sandisk (SNDK) and Visa (V), while Tractor Supply (TSCO) was among those with weaker-than-forecast reports.
President Donald Trump chose Kevin Warsh, who served as a governor on the central bank's board from 2006 to 2011, as head of the Federal Reserve. Before joining the Fed, Warsh served in the George W. Bush White House and worked at Morgan Stanley (MS).
All in all, I think that the pick could have been much worse. Warsh was known as an inflation "hawk" during the Bush administration.
Last Week’s Economic Reports
Core PPI rose 0.7% m/m in December vs. an expectation of 0.2%.
Pending home sales fell 9.3% m/m, marking a significant downturn in the housing market.
The Q3 GDP estimate was revised upward from a 4.3% anual rate to 4.4%.
November's PCE (the Fed's preferred inflation number) was up 0.5% (3% annual rate).
Up Next
Earnings reports expected next week include Walt Disney (DIS), Advanced Micro Devices (AMD), Merck (MRK), Pepsico (PEP), Alphabet (GOOG, GOOGL), Eli Lilly (LLY), Amazon.com (AMZN), ConocoPhillips (COP), and Philip Morris International (PM).
This week, investors will focus on the government's January jobs report, which is due Friday. Other economic data will include January auto sales on Monday and a preliminary reading on February consumer sentiment on Friday.
S&P 500 Sector and Stylebox Returns
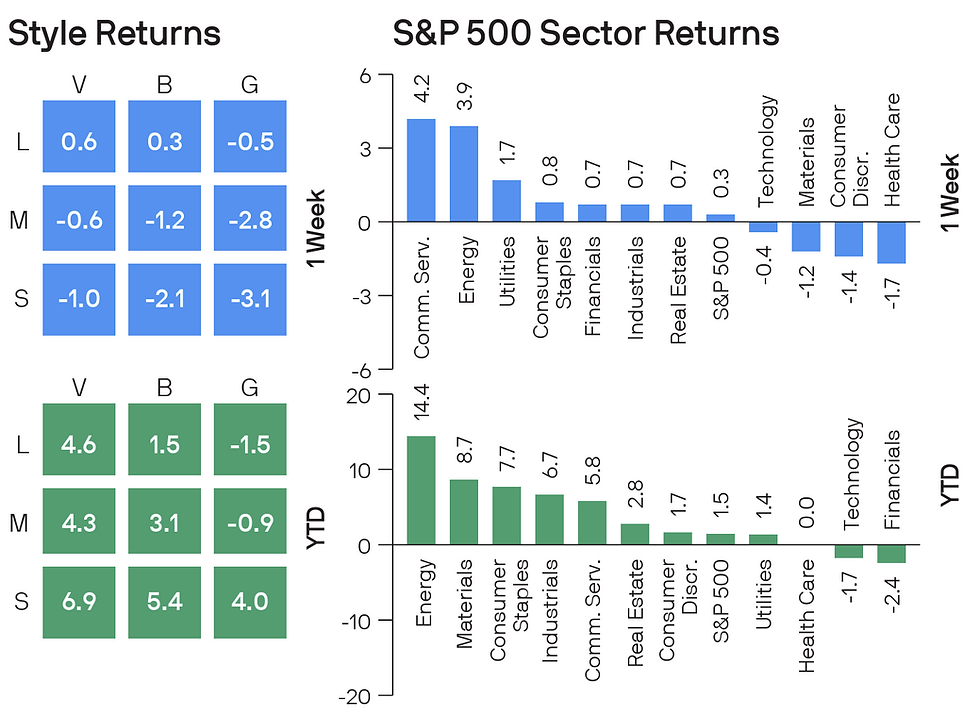
How to read the stylebox: The horizontal axis represents investment style, which can be value, blend, or growth for stocks and mutual funds. The vertical axis represents market capitalization for stocks, categorized into large, medium, and small companies. The number in each box represents the percentage growth of the category that is the intersection of the column and the row. For example, large-cap value is in the top-left corner box of the 9 boxes, so the large-cap value category is up (or down) by the percentage shown in that box.

Thought of the Week
What happens when, after years of near-zero inflation, it finally takes hold, and a heavily indebted government leans on subsidies and tax cuts to shield households? Japan gave markets a live demo this month.
Inflation has hovered above the Bank of Japan’s 2% target for much of the past four years, and medium-term inflation expectations have moved closer to U.S. levels. While this opens the door for policy normalization, the BoJ has been slow to raise rates, cautious of risks to fragile growth.
Meanwhile, households are facing price pressures not seen in decades. In a bid to ease the cost-of-living burden, Prime Minister Takaichi, who called snap elections this month, promised a two-year suspension of the food and beverages consumption tax. This follows earlier energy subsidies that helped cool recent inflation prints.
However, with public debt already around 200% of GDP, these fiscal announcements jolted the bond yields higher, which were already trading at multi-decade highs, as shown in the chart. At the same time, despite rising yields, the yen weakened sharply toward ¥160/$ as investors demanded a higher risk premium. A weaker yen risks adding fuel to inflation by pushing up the cost of imported food and energy.
While volatility eased after reassurances on fiscal discipline, this episode highlighted how narrow Japan’s policy path has become. Moreover, as a long-time provider of global liquidity, a sharp move higher in Japanese yields could pull capital back and push global yields higher. For investors, that may mean tempering expectations for a major decline in long-term yields and owning bonds for carry (i.e. in order to hold to maturity), not for a duration rally.
Source: JP Morgan (edited)
Thank you to all who attended this month's market Update webinar!
You can watch the replay here:
The episode is also available wherever you listen to podcasts!
Want more?
You can always find our latest Monthly Market Update webinar and past webinars here:
All the Best,
Gordon Achtermann, CFP®
703-573-7325
Your Best Path Financial Planning


